
When scientific characterization of materials is needed, spectroscopy is an essential technique to obtain information of the elemental or molecular composition in a specimen. Spectroscopy is an optical characterization tool where light from the sample is dispersed with a prism or diffraction grating, and the individual color-fingerprint for elements or molecules are recorded and analyzed.
Types of spectra
There are three different spectra: emission spectrum, continuous spectrum and absorption spectrum.
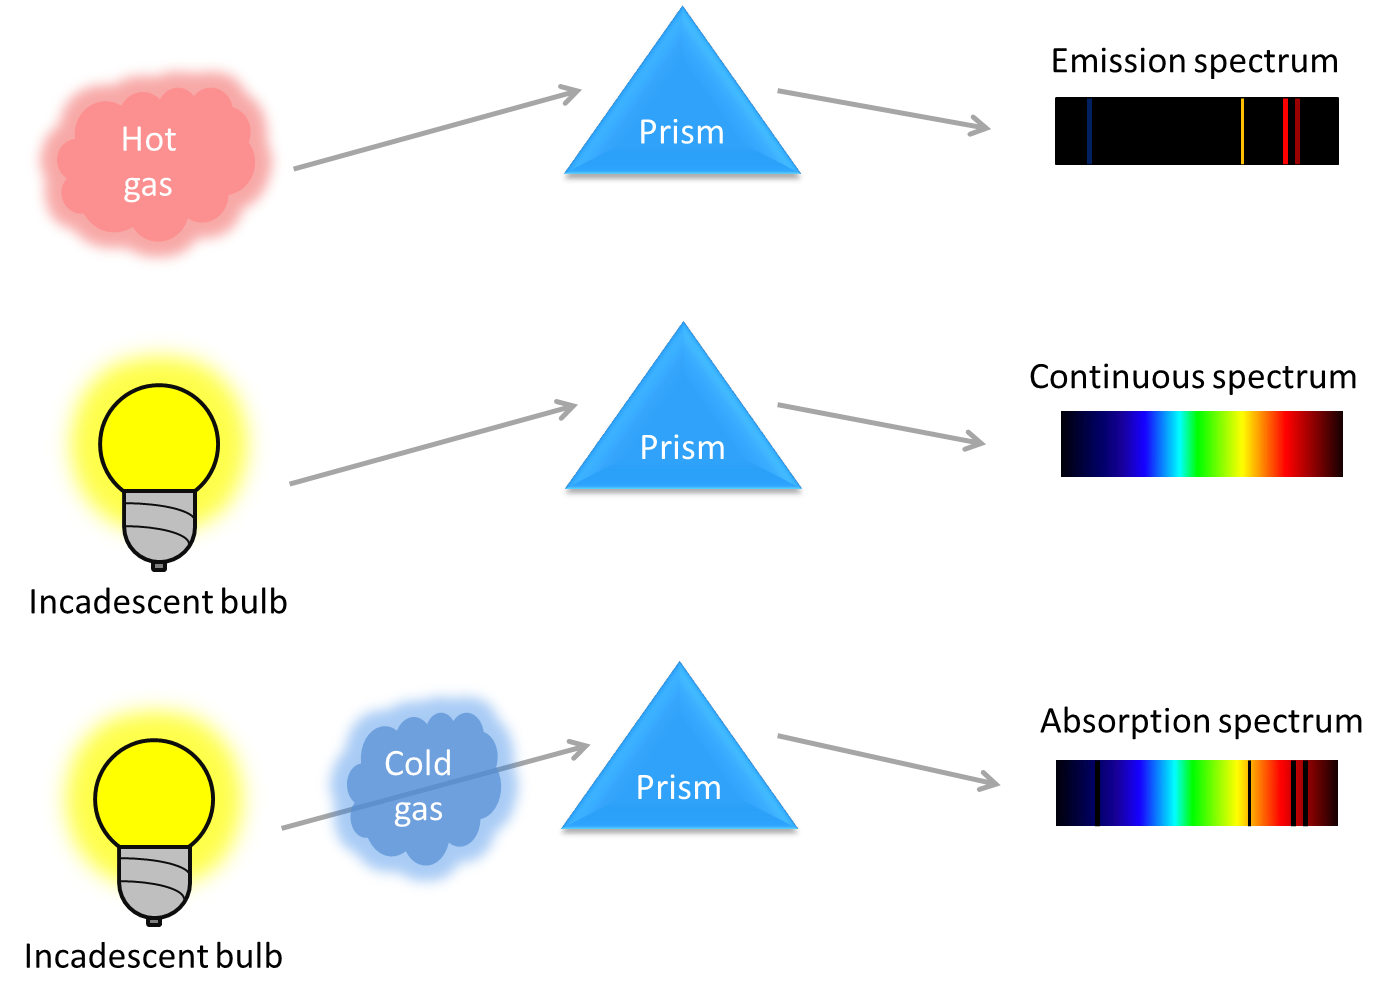
- Emission spectrum is produced by low density hot gases where the collision of atoms is limited. The emission color bands in the spectrum correspond to emitted photons of discrete energies. Photons are emitted when atoms in gases get excited and excited electrons transition back to their ground state (relaxation). For more info, see fluorescence. Since the possible energy transitions in atoms are fixed and variate for different elements, the emission spectrum can be used to identify elemental composition. An example for emission spectrum is sodium lamp that gives discrete color bands with the most pronounced two bands at the yellow-orange region (see figures for this spectrum).
- Continuous spectrum occurs when dense gases (or solids, liquids) are excited and the resulting emission color bands are broadened by collision between the atoms. A continuous light source (e.g. incandescent bulb, see figures for this spectrum) emit light in all wavelengths, as the broadened bands are overlap with each other in a way that individual emission lines can no longer can be identified. Blackbody (thermal) radiation is an example of continuous spectrum.
- Absorption spectrum results when continuous light passes through a cold and diluted (transparent) gas cloud. Atoms in the gas absorb light at discrete characteristic wavelengths, and re-emit it in all direction. Since it is very unlikely that the re-emitted photon has the same direction as the absorbed photon, the intensity of light at characteristic wavelengths will be lowered, darker bands will be shown in the absorption spectrum. In atoms the absorption and emission lines occur in exactly the same wavelengths (contrary to molecules, see fluorescence), one can think that the absorption spectrum is the exact inverse of the emission spectrum of the same element. An example for absorption spectrum is the Fraunhofer lines of the Sun (see figures for this spectrum).
Thus, there are two major spectroscopy techniques; emission spectroscopy where atoms in the sample are excited and the elemental composition is identified by their emission lines; and absorption spectroscopy where continuous light is shined to a transparent sample (e.g. gas, solution) and the absorption lines of the material is analyzed.
Building a spectrometer for emission and absorption spectroscopy
It is possible to home-build a spectrometer if we know how to do that. First we need an optical element that diffracts light and disperse it into the whole spectrum. In old spectrometers a simple prism was used, nowadays a diffraction grating or monochromator is used. For a diffraction grating, we need something that has a very fine grating pattern (comparable to the wavelength of light) embedded. A part of a DVD or CD disk can be used for that purpose, as DVDs/CDs hold information in very tiny bumps engraved in the plastic disk. There are shorter and longer bumps for the “zero”-s and “one”-s, and they are several hundreds of nanometer long in DVD disks which is comparable to the wavelength of visible light (400-700 nm).

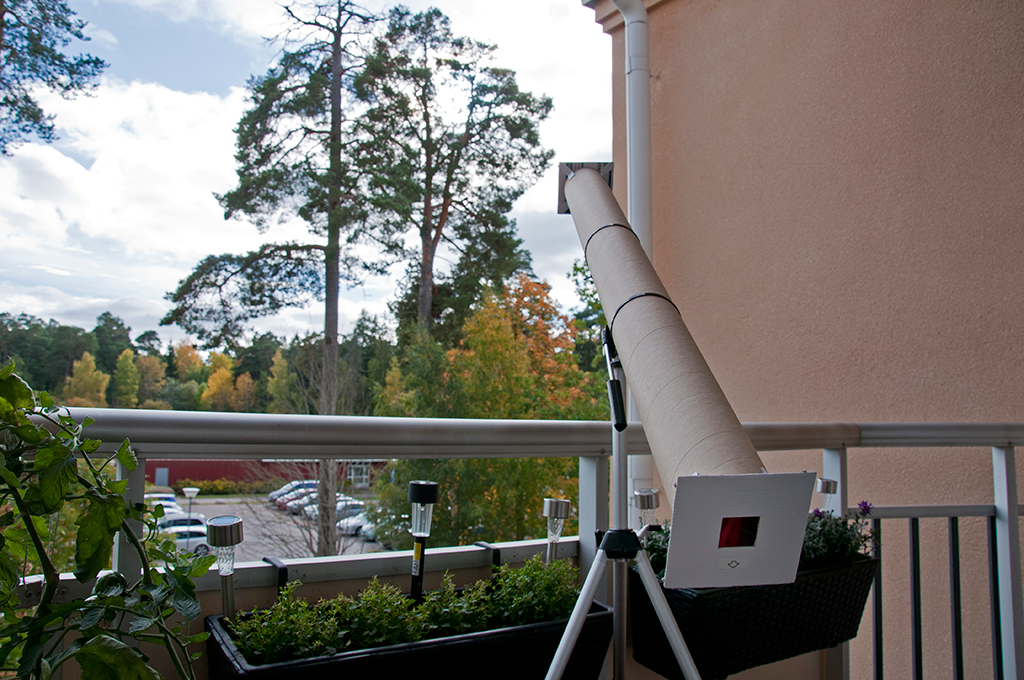
Secondly, we need a long tube with a small slit at one of the opening, this is where light will enter into our spectrometer tube. On the other end we mount our DVD-diffraction grating where we will see the dispersed spectral bands projected if we point the slit opening of our spectrometer to a light source. If the tube is longer, the resolution is better for the spectrometer, more separation of overlapping spectral bands can be achieved.
Emission spectroscopy with the home-built spectrometer
Several artificial light source has interesting emission spectra that can be analyzed with our home-built spectrometer. Moreover, from the emission spectra, the used elemental composition in different light sources can be identified. Incandescent bulbs gives light via thermal radiation from 3000 °C Wolfram filaments, their spectra are continuous. As our Sun’s spectrum is also continuous (5-6000 °C thermal radiation at the surface), the light of incandescent bulbs are very close to our natural light source on the Earth. On the contrary, in fluorescent light bulbs, different elements are used to mimic our Sun’s continuous spectrum with discrete blue-green-red emission bands, just like in our television or computer displays. A clear mercury-vapor fluorescent lamp has blue, green and yellow bands, but lack of red. Therefore in a good fluorescent lamp, apart from mercury, other extra elements needed to be used with red emission bands, to produce clearer white light. In a better fluorescent lamp, a combination of mercury and lanthanides are used such as Terbium and Europium. Another good example for emission spectrum is sodium-lamp. Sodium-lamps are usually placed next to roads or used as industrial lighting, and gives a yellow-orange light due to the strong emission bands of sodium-vapor at around 588 nm.

Absorption spectroscopy with the home-built spectrometer
A very nice absorption spectroscopy task is to analyze the Sun’s absorption lines, the so-called Fraunhofer lines. The inner region of the Sun produces a continuous spectrum light due to thermal radiation. When this continuous light reaches the outer cooler surface of the Sun (chromosphere), some colors of light are absorbed at characteristic wavelengths by gases, and re-emitted in all direction. Since it is very unlikely that the re-emitted photon has the same direction as the absorbed photon, the intensity of light at those wavelengths will be lowered and darker bands appear in the spectrum.
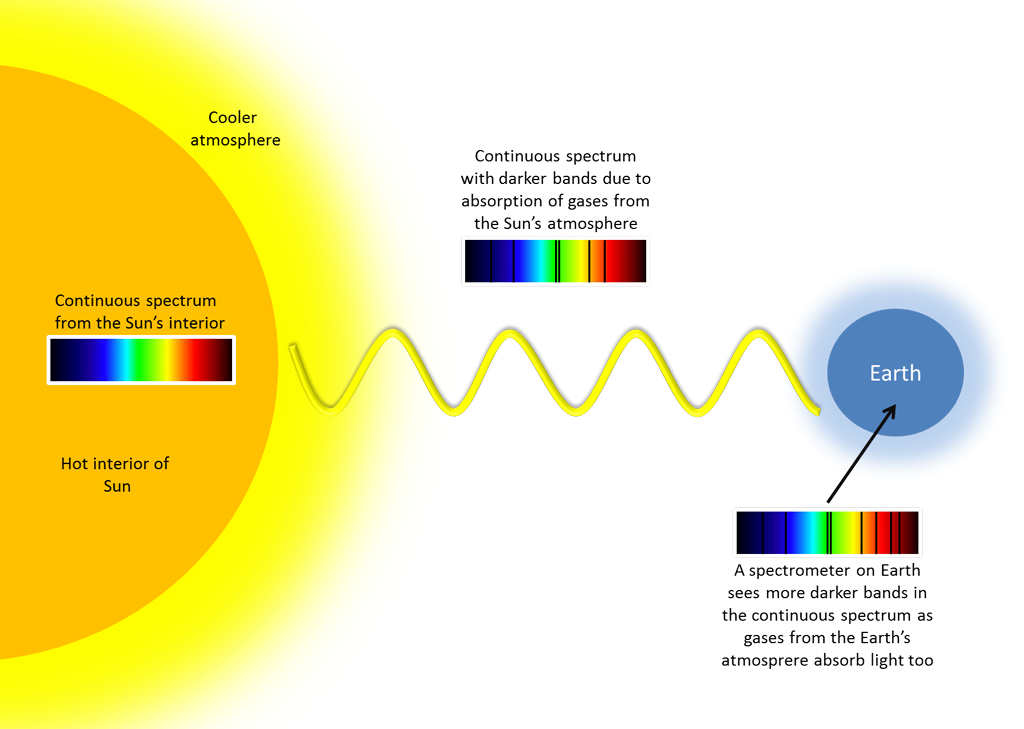
As this light travel through space and reaches the atmosphere of Earth, more darker bands will be created due to the absorption of gases (like oxygen) in Earth’s atmosphere. If a spectrometer is placed on the surface of Earth and carefully pointed at the bright sky where sunlight is scattered, this final spectrum with all the darker bands can be recorded. However it should be noted that pointing and looking directly to the Sun with any spectrometer or optical instrument can cause sever damage instantly to our eye so direct visualization of the Sun must be avoided!

Looking at the Sun’s spectrum, multiple stronger and weaker dark bands are visible that come from the different absorbing elements. Stronger absorption lines are usually identified by letters. It is interesting to mention the D-lines, which correspond to the same sodium lines we saw when the spectrometer was pointed at the high-pressure sodium lamp. During fusion in the core of the Sun, sodium and other elements are created, and as they migrate to the cooler outer region of the Sun, they absorb light at characteristic wavelengths.
